Jenny와 airbnb사이트 프로젝트를 진행하며 요금부분의 그래프를 구현한 내용입니다.
무엇보다도 canvas와 slider구현을 위한 엄청난 수학적 계산을 해주신 Jenny에게 이글을 바칩니다.. 🌹


폴더 구조는 이렇게 되어있는데
아래 Slider 과 ChartCanvas로 나눠서 구성했다.
📈 Slider
Slider에는 총 2개의 상태가 있다.
const { priceData, priceDispatch } = useContext(SearchContext);
const [avg, setAvg] = useState((min + max) / 2);
const [min, max] = [0, 1000000];
priceData : slider 가 가리키는 min,max 값 / useContext로 관리
avg : slider로 바꿀 때마다의 min max의 평균 값 / use State 로 관리
min max = 처음 그릴 그래프의 min, max 값 ( state 말고 변수로 관리 )

사실 원래 슬라이드의 Thumb(사진의 동그라미)는 하나인데
기획서상에서는 두개가 필요하므로 두 slider를 이어붙였다고 볼 수 있다.
전달 값
  const thumbSize = 24;
  const width = 365;
  const leftWidth =
    thumbSize + ((avg - min) / (max - min)) * (width - 2 * thumbSize);

  const rightWidth =
    thumbSize + ((max - avg) / (max - min)) * (width - 2 * thumbSize);

  const leftPercent = ((priceData.minPrice - min) / (avg - min)) * 100;
  const rightPercent = ((priceData.maxPrice - avg) / (max - avg)) * 100;
Slider Component
    <SliderDiv>
      <LeftInput
        type="range"
        min={min}
        max={avg}
        leftWidth={leftWidth}
        leftPercent={leftPercent}
        value={priceData.minPrice}
        onChange={({ target }) => handleMinSliderChange({ target })}
      />
      <RightInput
        type="range"
        min={avg}
        max={max}
        leftWidth={leftWidth}
        rightWidth={rightWidth}
        rightPercent={rightPercent}
        value={priceData.maxPrice}
        onChange={({ target }) => handleMaxSliderChange({ target })}
      />
    </SliderDiv>
각각의 Input 에게 계산한 값들을 전달하여 slider를 구성한다.
LeftInput - left: 0 / width: leftWidth / leftPercent
RightInput - left: leftWidht / width : rightWidth / rightPercent
const LeftInput = styled.input`
  position: absolute;
  left: 0;
  width: ${({ leftWidth }) => `${leftWidth}px`};
  -webkit-appearance: none;
  background-image: linear-gradient(
    to right,
    #e5e5e5 0%,
    #e5e5e5 ${({ leftPercent }) => `${leftPercent}%`},
    #333333 ${({ leftPercent }) => `${leftPercent}%`},
    #333333 100%
  );
`;
const RightInput = styled.input`
  position: absolute;
  left: ${({ leftWidth }) => `${leftWidth}px`};
  width: ${({ rightWidth }) => `${rightWidth}px`};
  -webkit-appearance: none;
  background-image: linear-gradient(
    to right,
    #333333 0%,
    #333333 ${({ rightPercent }) => `${rightPercent}%`},
    #e5e5e5 ${({ rightPercent }) => `${rightPercent}%`},
    #e5e5e5 100%
  );
`;
전달받은 값을 이용해 CSS 를 설정하며 렌더링이 되는 방식
📈 Canvas 그래프
❖ 상태
Cnavas 에는 총 2개의 상태가 와 1개의 useRef를 가지고 있다.
  const { priceData } = useContext(SearchContext);
  const [chart, setChart] = useState({ width: 0, height: 0 });
  const chartRef = useRef();
priceData : slider 가 가리키는 min,max 값 / useContext로 관리
chart : chart의 width, height 값 / useState로 관리
charRef = CartCanvas 자체 ( useRef로 관리 )
Jenny와 페어프로그래밍으로 진행하며 많이 고민했던 부분인데,
일단은 기본적으로 Jenny가 차트를 어떤 방식으로 그릴지 어느정도 구성을 한 상태에서
미세한 부분이 어긋나 차트가 정상적으로 보이지 않고 있었다.
❖ 구현 방법

일단 drawChart를 통해 그래프를 그리고
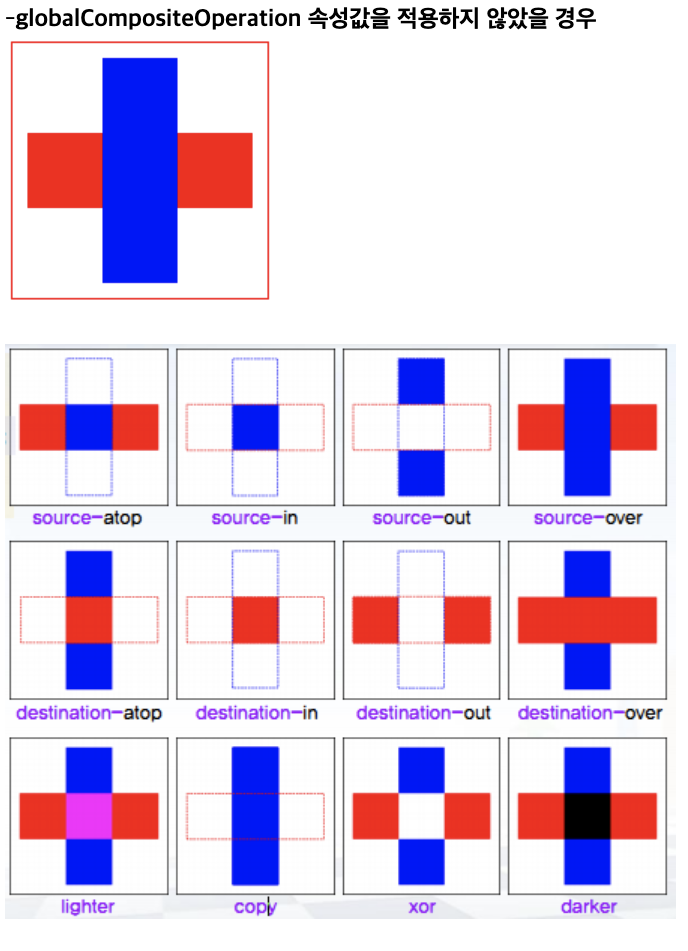
drawOver로 그린 사각형으로 해당 부분을 감싸며 globalCompositeOperation 을 통해 canvas연산을 통해 나오게 한다.
❖ 코드
drawChart 함수
const drawChart = (ctx, points) => {
    ctx.beginPath();
    ctx.moveTo(points[0].x, points[0].y);

    for (var i = 0; i < points.length - 1; i++) {
      var x_mid = (points[i].x + points[i + 1].x) / 2;
      var y_mid = (points[i].y + points[i + 1].y) / 2;
      var cp_x1 = (x_mid + points[i].x) / 2;
      var cp_x2 = (x_mid + points[i + 1].x) / 2;

      ctx.quadraticCurveTo(cp_x1, points[i].y, x_mid, y_mid);

      ctx.quadraticCurveTo(
        cp_x2,
        points[i + 1].y,
        points[i + 1].x,
        points[i + 1].y
      );
      ctx.strokeStyle = 'lightGray';
      ctx.stroke();
    }

    ctx.fillStyle = '#E5E5E5';
    ctx.fill();
  };
drawOver 함수
  const drawOver = (ctx, minPrice, maxPrice) => {
    //
    ctx.globalCompositeOperation = 'source-atop';
    ctx.fillStyle = '#333';
    let leftWidth = (minPrice * chart.width) / 1000000;
    const rightWidth = (maxPrice * chart.width) / 1000000;
    ctx.beginPath();
    ctx.moveTo(0, 0);
    ctx.lineTo(0, chart.height);
    ctx.lineTo(leftWidth, chart.height);
    ctx.lineTo(leftWidth, 2);
    ctx.lineTo(rightWidth, 2);
    ctx.lineTo(rightWidth, chart.height);
    ctx.lineTo(chart.width, chart.height);
    ctx.lineTo(0, chart.width);
    ctx.lineTo(0, 0);

    ctx.fill();
  };
함수실행 및 렌더링
const ctx = chartRef.current?.getContext('2d');
  ctx && chart.height && chart.width && drawChart(ctx, points);
  ctx && drawOver(ctx, priceData.minPrice, priceData.maxPrice);
  return (
    <PriceChartViewDiv>
      <ChartCanvas width="365px" id="canvas" ref={chartRef}></ChartCanvas>
      <Slider />
    </PriceChartViewDiv>
  );
❖ 시행착오
1) drawOver을 두개로 생성

  const drawMinOver = (ctx, minPrice, maxPrice) => {
    ctx.globalCompositeOperation = 'destination-atop';
    ctx.fillStyle = 'black';
    let leftWidth = (minPrice * chart.width) / 1000000;
    const rightWidth = (maxPrice * chart.width) / 1000000;
    ctx.fillRect(1, 1, leftWidth, chart.height - 1);
    ctx.fill();
  };

  const drawMaxOver = (ctx, minPrice, maxPrice) => {
    ctx.globalCompositeOperation = 'destination-atop';
    ctx.fillStyle = 'black';
    const rightWidth = (maxPrice * chart.width) / 1000000;
    ctx.fillRect(rightWidth, 1, chart.width - 1, chart.height - 1);
    ctx.fill();
  };
처음엔 over 사각형 두개를 만들어 두고 두개를 동시에 연산하려고 했지만 연산이 먹지 않았다...

<- 고통의 그림
오랜 고민끝에 나온 아이디어
바로 drawOver를 lineTo로 다 그려버리자!!!!
해서 나온 뿌듯한 합작이다.
2) useEffect 에서 렌더링 관리
수정 전
 useEffect(() => {
    setChart({
      width: chartRef.current.width,
      height: chartRef.current.height,
    });
    const ctx = chartRef.current.getContext('2d');
    chart.height && chart.width && drawChart(ctx, points);
    drawOver(ctx, priceData.minPrice, priceData.maxPrice);
  }, [chart.height, priceData.maxPrice, priceData.minPrice]);

  return (
    <PriceChartViewDiv>
      <ChartCanvas width="365px" ref={chartRef}></ChartCanvas>
      <Slider />
    </PriceChartViewDiv>
  );
};
수정 후
useEffect(() => {
    setChart({
      width: chartRef.current.width,
      height: chartRef.current.height,
    });
  }, [chart.height]);

  const ctx = chartRef.current?.getContext('2d');
  ctx && chart.height && chart.width && drawChart(ctx, points);
  ctx && drawOver(ctx, priceData.minPrice, priceData.maxPrice);
  return (
    <PriceChartViewDiv>
      <ChartCanvas width="365px" id="canvas" ref={chartRef}></ChartCanvas>
      <Slider />
    </PriceChartViewDiv>
  );
};
useEffect에서 canvas를 그리는걸 진행했다.
사실 이 canvas연산은 drawChart가 그려진 후 -> drawOver가 그려질때 연산이 되는 방식이라
canvas가 그려지는 순서가 중요했는데 useEffect안에서 그려지니
useEffect의 dependency요소인 priceData 가 변경될때마다 drawChart가 재 렌더링 되버려 연산이 제대로 동작하지 않았다.
다시한번 명심하자 useEffect에는 렌더링 요소가 들어가면 안된다.
📌 globalCompositeOperation
캔버스의 도형을 그릴 때 순서를 제한하며 도형합성을 하는 방법

이렇게 canvas도형을 만들 때 다양한 연산이 가능하다
'🍿 Project' 카테고리의 다른 글
| [Side PJ] airdnd 2부 - 상태에 따른 CSS 변화 (상태지옥 State) (0) | 2021.06.05 |
|---|---|
| [SidePJ] React 모달 영역 밖 클릭시 닫기 (0) | 2021.06.03 |
| [SidePJ] airdnd 1부 - 프로젝트 시작 ! (0) | 2021.05.28 |
| [side PJ ] ⚾️야구게임 - 문제상황과 해결과정 (0) | 2021.05.20 |
| [Side PJ] 야구게임 - 삽질과 배운점🛠 (0) | 2021.05.20 |


댓글